During your time with PyTorch on GPUs, you may be familiar with this common error message:
torch.cuda.OutOfMemoryError: CUDA out of memory. Tried to allocate 512.00 MiB. GPU 0 has a total capacity of 79.32 GiB of which 401.56 MiB is free.
In this series, we show how to use memory tooling, including the Memory Snapshot, the Memory Profiler, and the Reference Cycle Detector to debug out of memory errors and improve memory usage.
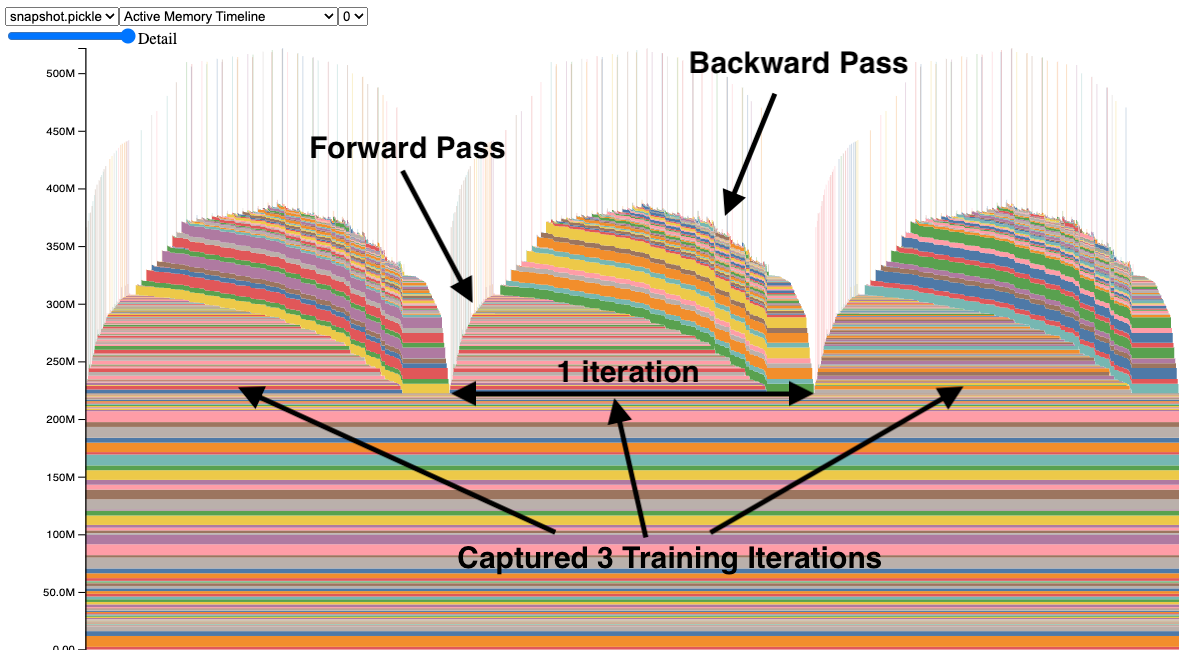
The Memory Snapshot tool provides a fine-grained GPU memory visualization for debugging GPU OOMs. Captured memory snapshots will show memory events including allocations, frees and OOMs, along with their stack traces.
In a snapshot, each tensor’s memory allocation is color coded separately. The x axis is over time, and the y axis is the amount of GPU memory in MB. The snapshot is interactive, so we can observe the stack trace for any allocation by mousing over. Try it yourself at https://github.com/pytorch/pytorch.github.io/blob/site/assets/images/understanding-gpu-memory-1/snapshot.html.
In this snapshot, there are 3 peaks showing the memory allocations over 3 training iterations (this is configerable). When looking at the peaks, it is easy to see the rise of memory in the forward pass and the fall during the backward pass as the gradients are computed. It is also possible to see that the program has the same pattern of memory use iteration to iteration. One thing that stands out is the many tiny spikes in memory, by mousing over them, we see that they are buffers used temporarily by convolution operators.
Capturing Memory Snapshots
The API to capture memory snapshots is fairly simple and available in torch.cuda.memory:
- Start:
torch.cuda.memory._record_memory_history(max_entries=100000) - Save:
torch.cuda.memory._dump_snapshot(file_name) - Stop:
torch.cuda.memory._record_memory_history(enabled=None)
Code Snippet (for full code sample, see Appendix A):
   # Start recording memory snapshot history, initialized with a buffer
   # capacity of 100,000 memory events, via the `max_entries` field.
   torch.cuda.memory._record_memory_history(
       max_entries=MAX_NUM_OF_MEM_EVENTS_PER_SNAPSHOT
   )

   # Run your PyTorch Model.
   # At any point in time, save a snapshot to file for later.
   for _ in range(5):
       pred = model(inputs)
       loss_fn(pred, labels).backward()
       optimizer.step()
       optimizer.zero_grad(set_to_none=True)

   # In this sample, we save the snapshot after running 5 iterations.
   #   - Save as many snapshots as you'd like.
   #   - Snapshots will save last `max_entries` number of memory events
   #     (100,000 in this example).
   try:
       torch.cuda.memory._dump_snapshot(f"{file_prefix}.pickle")
   except Exception as e:
       logger.error(f"Failed to capture memory snapshot {e}")

   # Stop recording memory snapshot history.
   torch.cuda.memory._record_memory_history(enabled=None)
To visualize the snapshot file, we have a tool hosted at https://pytorch.org/memory_viz. There, you can drag and drop your saved snapshot file and it will plot each allocation over time. Privacy Note: The tool will not save your snapshot.

Alternatively, you can generate an HTML from a .pickle by using the script at pytorch/torch/cuda/_memory_viz.py, here is an example:
python torch/cuda/_memory_viz.py trace_plot snapshot.pickle -o snapshot.html
Debugging CUDA OOMs
Let’s look at how we can use the memory snapshot tool to answer:
- Why did a CUDA OOM happen?
- Where is the GPU Memory being used?
ResNet50 with a bug
We’ve taken a look at a properly working model in the first snapshot. Now, let’s take a look at a training example with a bug, see snapshot:
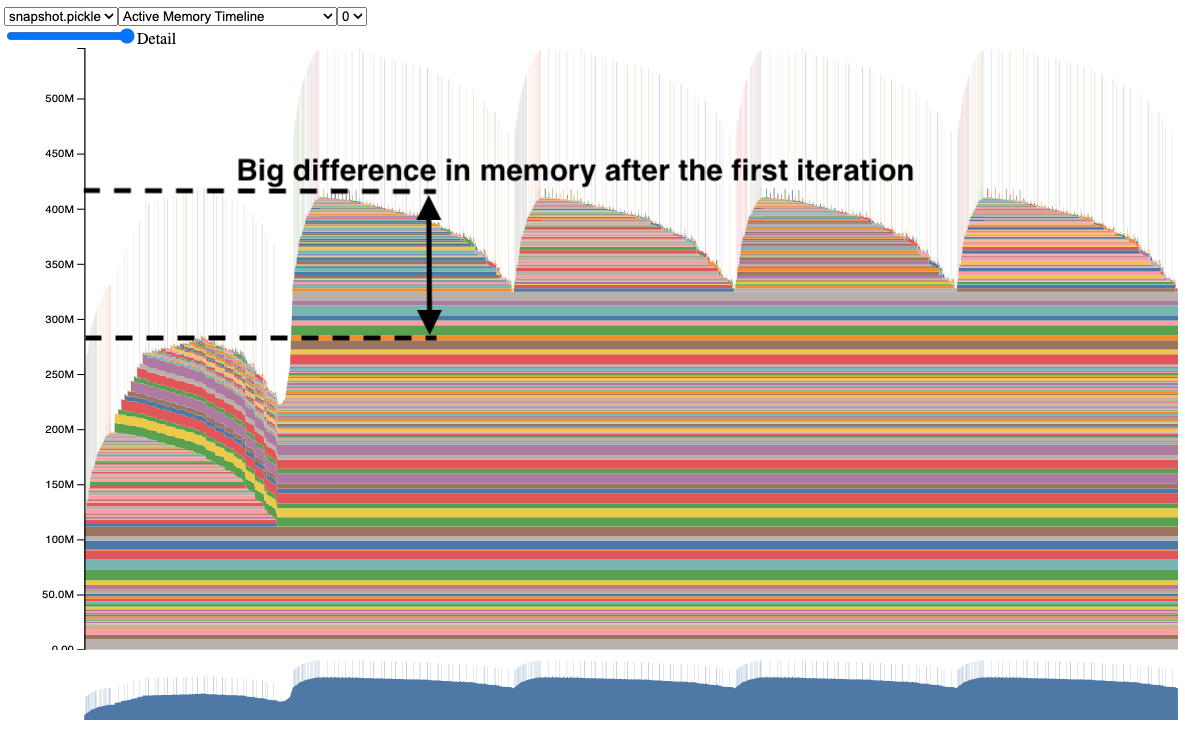
Notice how the second iteration uses far more memory than the first iteration. If this model were much larger, it could have CUDA OOM’d in the second iteration without much more insight into why.
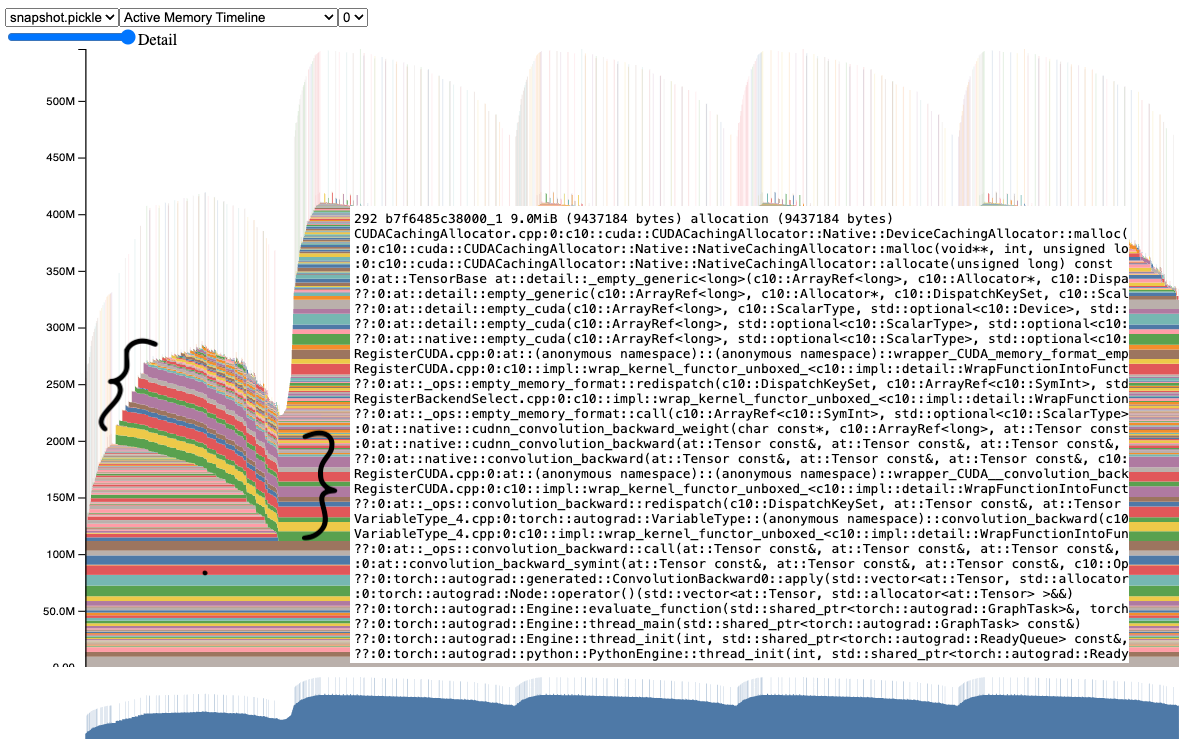
When examining this snapshot further, we can clearly see that several tensors are staying alive from the first iteration to the second and later iterations. If we mouse over one of these tensors, it would show a stack trace suggesting that these were gradient tensors.
And indeed if we go to the code, we can see that it doesn’t clear the gradient tensors, when it could have cleared them before the forward.
Before:
        for _ in range(num_iters):
          pred = model(inputs)
          loss_fn(pred, labels).backward()
          optimizer.step()
After:
        for _ in range(num_iters):
          pred = model(inputs)
          loss_fn(pred, labels).backward()
          optimizer.step()
          # Add this line to clear grad tensors
          optimizer.zero_grad(set_to_none=True)
We can simply add an optimizer.zero_grad(set_to_none=True) instruction to clear the gradient tensors from iteration to iteration (more details about why we need to zero the gradients here: https://pytorch.org/tutorials/recipes/recipes/zeroing_out_gradients.html).
This is a simplification of a bug we’ve found in more complicated programs using this tool. We encourage you to try out the Memory Snapshot on your GPU memory problems and let us know how it goes.
ResNet50 after bug fix
After applying the fix, the snapshot seems to be clearing the gradients now.
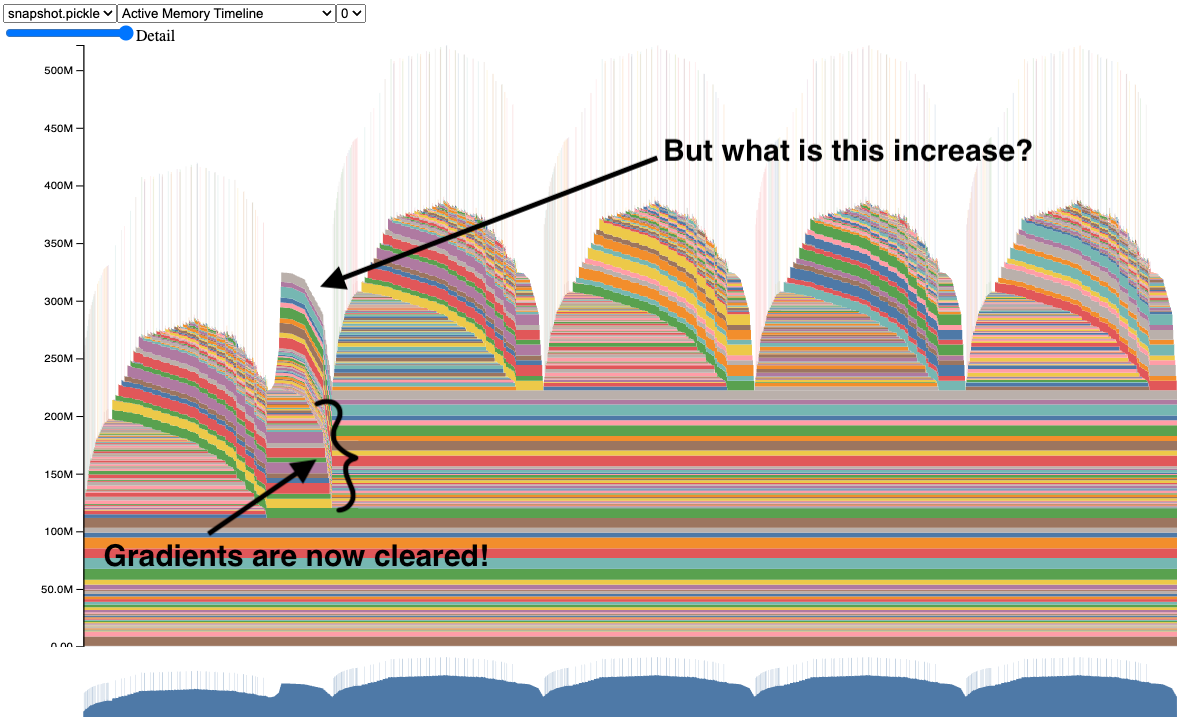
We now have the snapshot of a properly working ResNet50 model. Try out the code yourself (see code sample in Appendix A).
But you may be wondering, why is there still an increase in memory after the first iteration? To answer this, let’s visit the Memory Profiler in the next section.
Categorized Memory Usage
The Memory Profiler is an added feature of the PyTorch Profiler that categorizes memory usage over time. We still rely on the Memory Snapshot for stack traces for deep dives into memory allocations.
To generate a memory timeline, here is a code snippet (full code sample in Appendix B):
   # Initialize the profiler context with record_shapes, profile_memory,
   # and with_stack set to True.
   with torch.profiler.profile(
       activities=[
           torch.profiler.ProfilerActivity.CPU,
           torch.profiler.ProfilerActivity.CUDA,
       ],
       schedule=torch.profiler.schedule(wait=0, warmup=0, active=6, repeat=1),
       record_shapes=True,
       profile_memory=True,
       with_stack=True,
       on_trace_ready=trace_handler,
   ) as prof:
       # Run the PyTorch Model inside the profile context.
       for _ in range(5):
           prof.step()
           with record_function("## forward ##"):
               pred = model(inputs)

           with record_function("## backward ##"):
               loss_fn(pred, labels).backward()

           with record_function("## optimizer ##"):
               optimizer.step()
               optimizer.zero_grad(set_to_none=True)

   # Construct the memory timeline HTML plot.
   prof.export_memory_timeline(f"{file_prefix}.html", device="cuda:0")
For further reference, see https://pytorch.org/docs/main/profiler.html.
The Memory Profiler automatically generates categories based on the graph of tensor operations recorded during profiling.
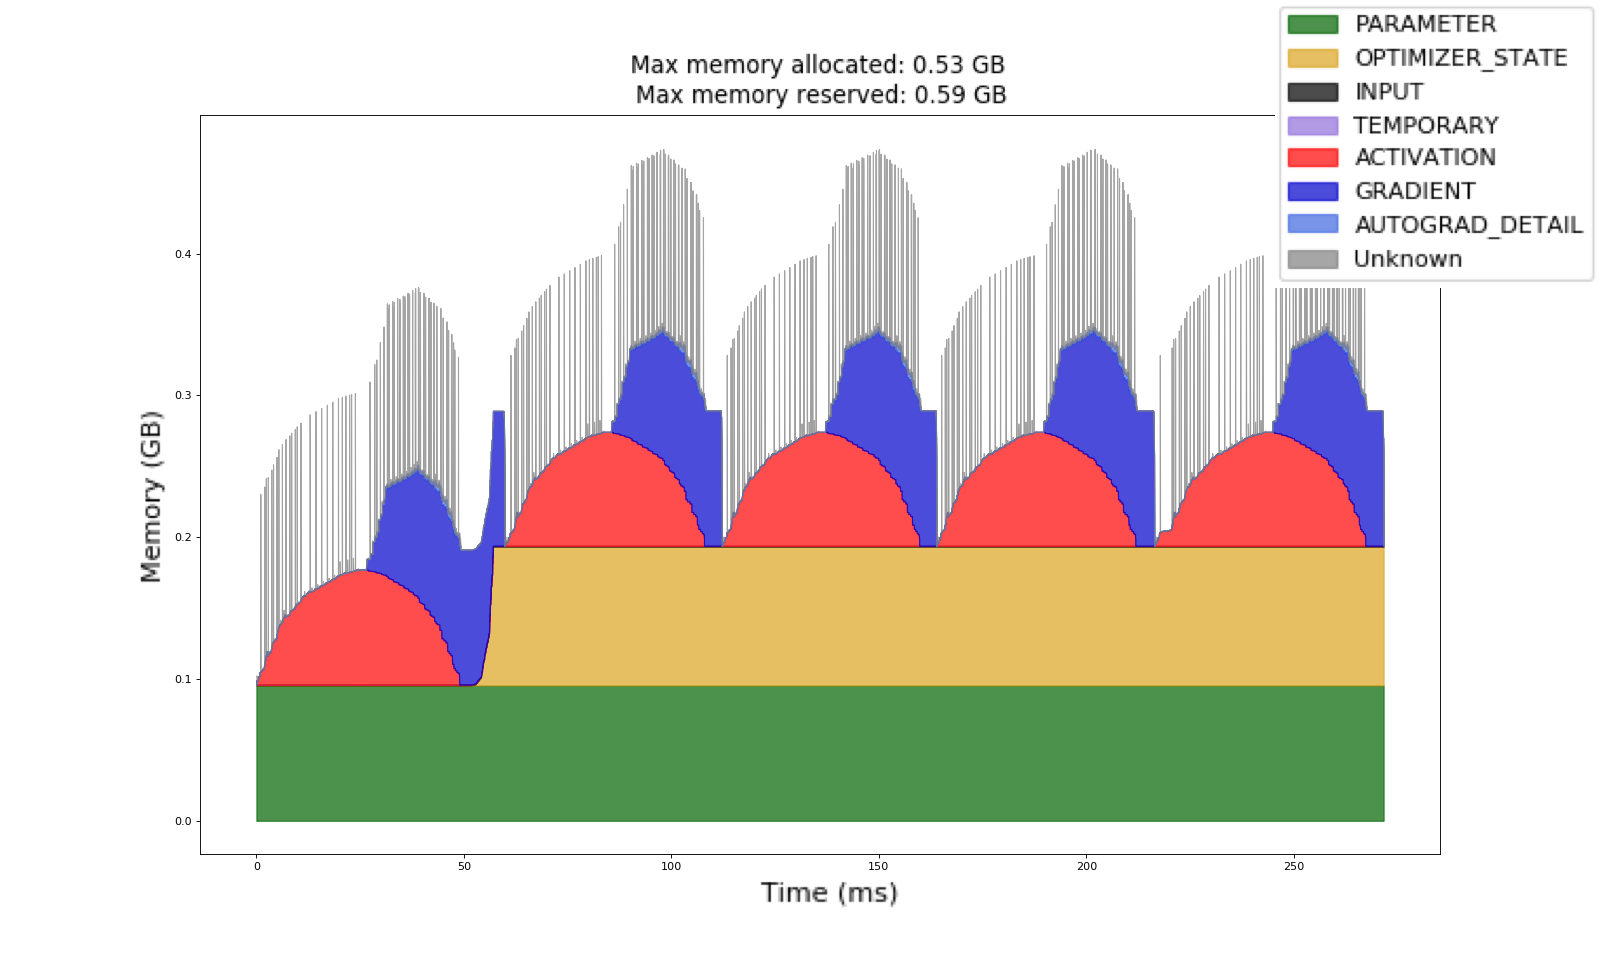
In this Memory Timeline collected using the Memory Profiler, we have the same training example as before. We can observe the gradients in blue are now being cleared from iteration to iteration. We can also notice that the optimizer state in yellow is allocated after the first iteration, and is kept constant for the rest of the job.
This optimizer state is the reason behind the increase of GPU memory from the first iteration to the second. Try out the code yourself (see code sample in Appendix B). The Memory Profiler helps to improve training memory understanding so that model authors can figure out which categories are using the most GPU memory.
Where can I find these tools?
We hope that these tools will greatly improve your ability to debug CUDA OOMs and to understand your memory usage by category.
The Memory Snapshot and the Memory Profiler are available in the v2.1 release of PyTorch as experimental features.
- More information about the Memory Snapshot can be found in the PyTorch Memory docs here.
- More details about the Memory Profiler can be found in the PyTorch Profiler docs here.
Feedback
We look forward to hearing from you about any enhancements, bugs or memory stories that our tools helped to solve! As always, please feel free to open new issues on PyTorch’s Github page.
We are also open to contributions from the OSS community, feel free to tag Aaron Shi and Zachary DeVito in any Github PRs for reviews.
Acknowledgements
Really appreciate the content reviewers, Mark Saroufim and Gregory Chanan, for reviewing this post and improving its readability.
Really appreciate the code reviews and feedback from Adnan Aziz and Lei Tian.
Appendix
Appendix A - ResNet50 Memory Snapshot Code Example
# (c) Meta Platforms, Inc. and affiliates.
import logging
import socket
from datetime import datetime, timedelta

import torch

from torchvision import models

logging.basicConfig(
   format="%(levelname)s:%(asctime)s %(message)s",
   level=logging.INFO,
   datefmt="%Y-%m-%d %H:%M:%S",
)
logger: logging.Logger = logging.getLogger(__name__)
logger.setLevel(level=logging.INFO)

TIME_FORMAT_STR: str = "%b_%d_%H_%M_%S"

# Keep a max of 100,000 alloc/free events in the recorded history
# leading up to the snapshot.
MAX_NUM_OF_MEM_EVENTS_PER_SNAPSHOT: int = 100000

def start_record_memory_history() -> None:
   if not torch.cuda.is_available():
       logger.info("CUDA unavailable. Not recording memory history")
       return

   logger.info("Starting snapshot record_memory_history")
   torch.cuda.memory._record_memory_history(
       max_entries=MAX_NUM_OF_MEM_EVENTS_PER_SNAPSHOT
   )

def stop_record_memory_history() -> None:
   if not torch.cuda.is_available():
       logger.info("CUDA unavailable. Not recording memory history")
       return

   logger.info("Stopping snapshot record_memory_history")
   torch.cuda.memory._record_memory_history(enabled=None)

def export_memory_snapshot() -> None:
   if not torch.cuda.is_available():
       logger.info("CUDA unavailable. Not exporting memory snapshot")
       return

   # Prefix for file names.
   host_name = socket.gethostname()
   timestamp = datetime.now().strftime(TIME_FORMAT_STR)
   file_prefix = f"{host_name}_{timestamp}"

   try:
       logger.info(f"Saving snapshot to local file: {file_prefix}.pickle")
       torch.cuda.memory._dump_snapshot(f"{file_prefix}.pickle")
   except Exception as e:
       logger.error(f"Failed to capture memory snapshot {e}")
       return

# Simple Resnet50 example to demonstrate how to capture memory visuals.
def run_resnet50(num_iters=5, device="cuda:0"):
   model = models.resnet50().to(device=device)
   inputs = torch.randn(1, 3, 224, 224, device=device)
   labels = torch.rand_like(model(inputs))
   optimizer = torch.optim.SGD(model.parameters(), lr=1e-2, momentum=0.9)
   loss_fn = torch.nn.CrossEntropyLoss()

   # Start recording memory snapshot history
   start_record_memory_history()

   for _ in range(num_iters):
       pred = model(inputs)
       loss_fn(pred, labels).backward()
       optimizer.step()
       optimizer.zero_grad(set_to_none=True)

   # Create the memory snapshot file
   export_memory_snapshot()

   # Stop recording memory snapshot history
   stop_record_memory_history()

if __name__ == "__main__":
    # Run the resnet50 model
    run_resnet50()
Appendix B - ResNet50 Memory Profiler Code Example
# (c) Meta Platforms, Inc. and affiliates.
import logging
import socket
from datetime import datetime, timedelta

import torch

from torch.autograd.profiler import record_function
from torchvision import models

logging.basicConfig(
   format="%(levelname)s:%(asctime)s %(message)s",
   level=logging.INFO,
   datefmt="%Y-%m-%d %H:%M:%S",
)
logger: logging.Logger = logging.getLogger(__name__)
logger.setLevel(level=logging.INFO)

TIME_FORMAT_STR: str = "%b_%d_%H_%M_%S"

def trace_handler(prof: torch.profiler.profile):
   # Prefix for file names.
   host_name = socket.gethostname()
   timestamp = datetime.now().strftime(TIME_FORMAT_STR)
   file_prefix = f"{host_name}_{timestamp}"

   # Construct the trace file.
   prof.export_chrome_trace(f"{file_prefix}.json.gz")

   # Construct the memory timeline file.
   prof.export_memory_timeline(f"{file_prefix}.html", device="cuda:0")

def run_resnet50(num_iters=5, device="cuda:0"):
   model = models.resnet50().to(device=device)
   inputs = torch.randn(1, 3, 224, 224, device=device)
   labels = torch.rand_like(model(inputs))
   optimizer = torch.optim.SGD(model.parameters(), lr=1e-2, momentum=0.9)
   loss_fn = torch.nn.CrossEntropyLoss()

   with torch.profiler.profile(
       activities=[
           torch.profiler.ProfilerActivity.CPU,
           torch.profiler.ProfilerActivity.CUDA,
       ],
       schedule=torch.profiler.schedule(wait=0, warmup=0, active=6, repeat=1),
       record_shapes=True,
       profile_memory=True,
       with_stack=True,
       on_trace_ready=trace_handler,
   ) as prof:
       for _ in range(num_iters):
           prof.step()
           with record_function("## forward ##"):
               pred = model(inputs)

           with record_function("## backward ##"):
               loss_fn(pred, labels).backward()

           with record_function("## optimizer ##"):
               optimizer.step()
               optimizer.zero_grad(set_to_none=True)

if __name__ == "__main__":
    # Warm up
    run_resnet50()
    # Run the resnet50 model
    run_resnet50()
